Tamil Nadu, Chennai - 600040
info@ksemawealth.com
| Since Jan 2019 | ALPHA | MULTICAP | NIFTY50TRI |
| Average Monthly Return | 1.3% | 1.5% | 1.1% |
| Monthly Maximum Loss | -24.7% | -29.9% | -23.0% |
| Month of Maximum Loss | Mar-20 | Mar-20 | Mar-20 |
| Annualized Return | 14.9% | 17.3% | 12.5% |
| Annualized Volatility | 19.5% | 21.5% | 17.4% |
| % of Winning Months (Against Benchmark) | 55.7% | 58.0% | na |
| % of Gained Months | 62.5% | 64.8% | 60.2% |
| YTD | 9.4% | 10.7% | 5.6% |
| Sharpe (RF 7%) | 0.41 | 0.48 | 0.31 |
| Alpha | 3.4% | 6.3% | na |
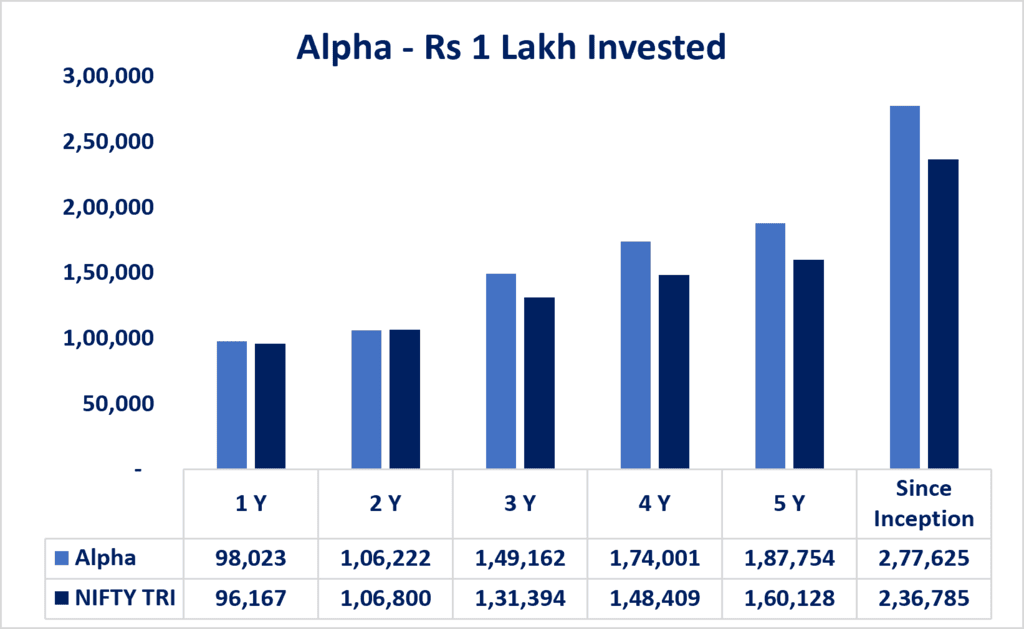
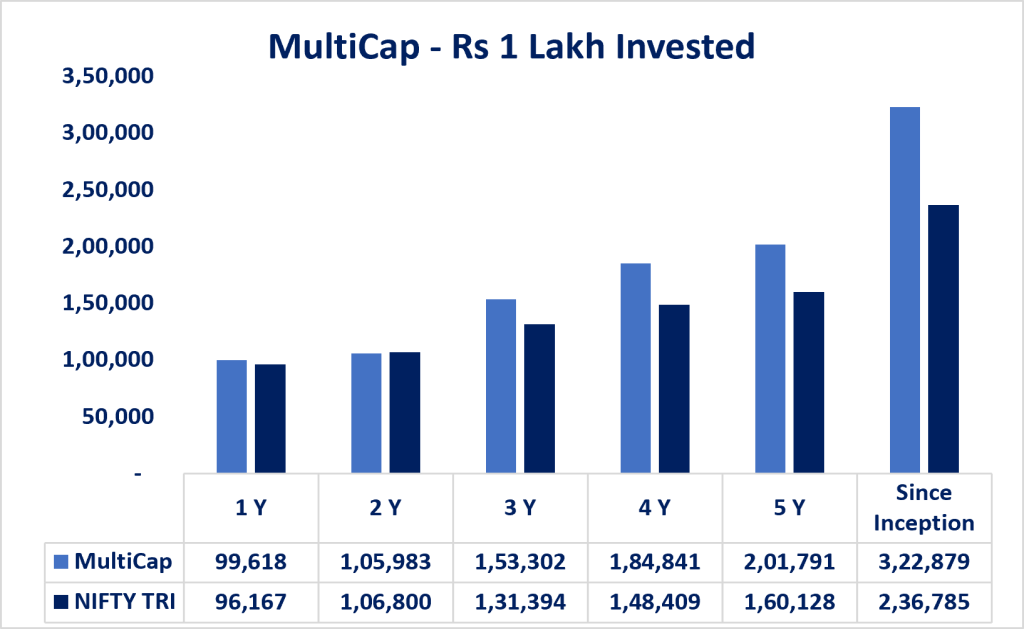
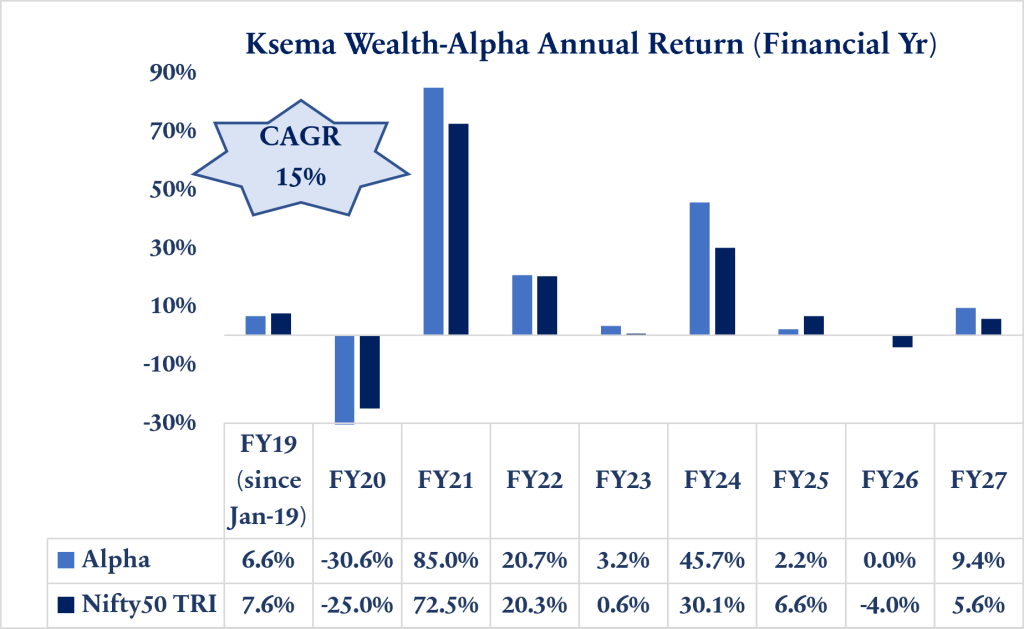
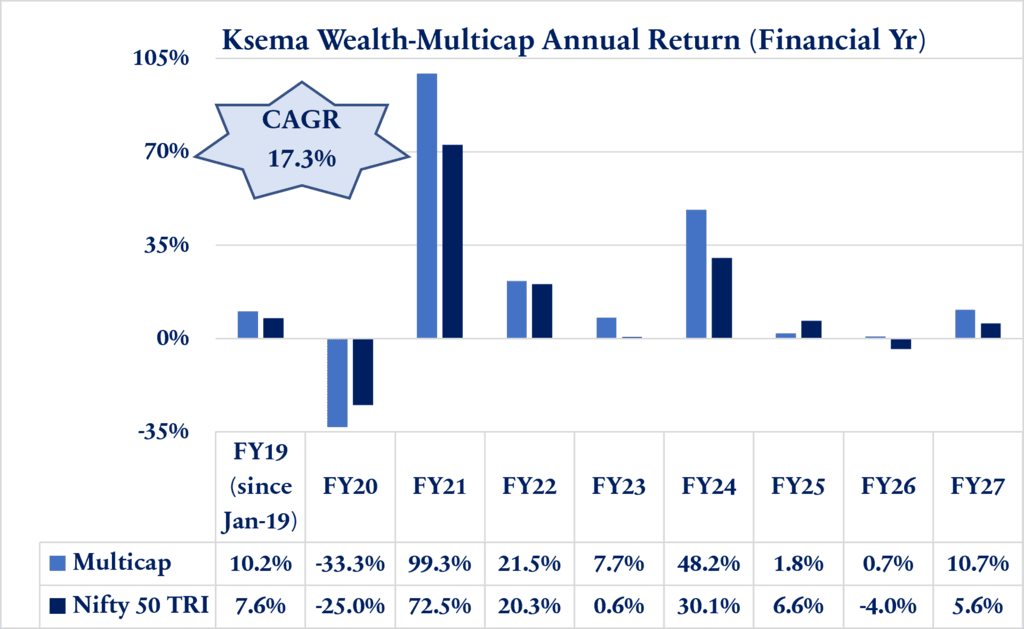
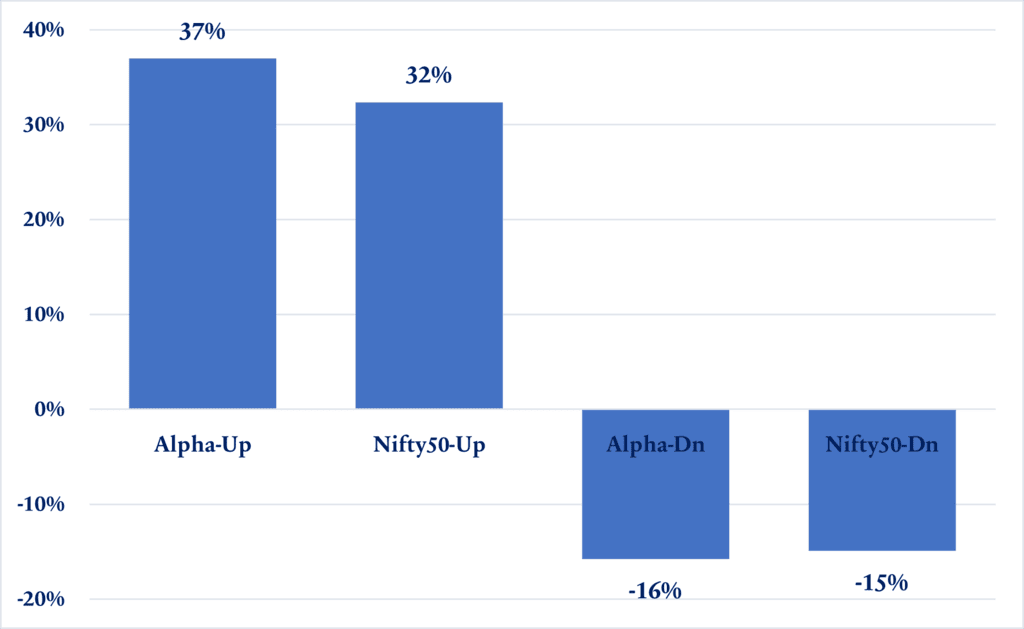
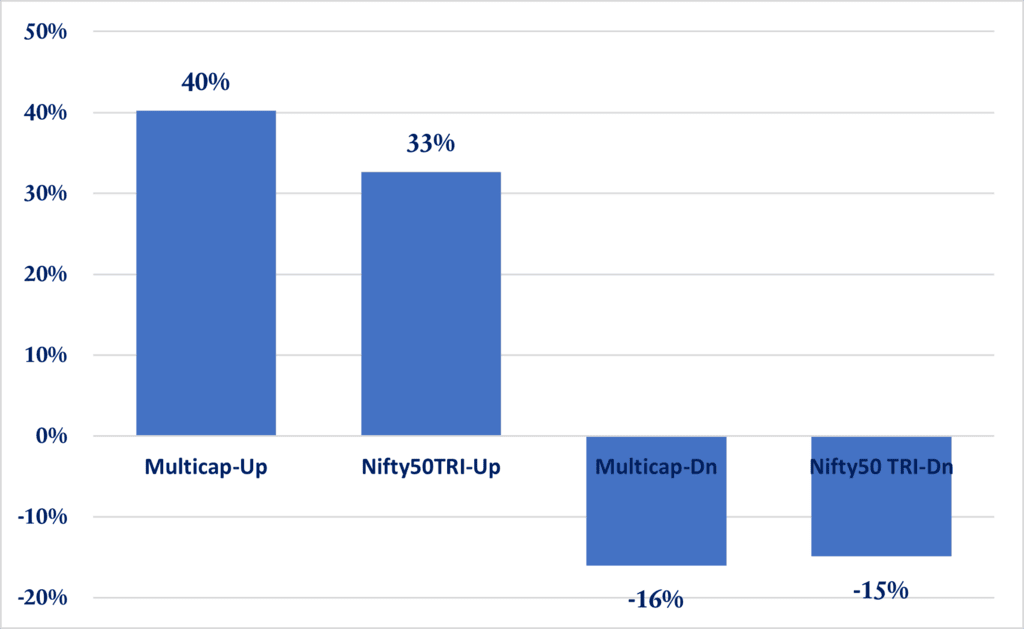
Both Ksema–Alpha & Ksema-Multicap has outperformed in “up trending” & “down trending” market; Both Capture Up: Dn ratio is above 1.
This presentation is for information purposes only and is not an offer to sell or a solicitation to buy any Securities. The views expressed herein are based on the basis of internal data, publicly available information & other sources believed to be reliable. Any calculations made are approximations meant as guidelines only, which need to be confirmed before relying on them. These views alone are not sufficient and should not be used for the development or implementation of an investment strategy. It should not be construed as investment advice to any party. All opinions and estimates included here constitute our view as of this date and are subject to change without notice. Neither Ksema Wealth Private Limited, nor any person connected with it, accepts any liability arising from the use of this information. The recipient of this material should rely on their investigations and take their own professional advice